

How PMT Score Is Calculated Step by Step in NSER System is a key topic for anyone trying to understand how eligibility for government support programs is determined in Pakistan.
The NSER survey collects detailed household information, including income, family size, and assets, and then applies a scoring system to generate your PMT score.
Why PMT Score Matters in Pakistan
PMT scores directly impact access to critical social programs in Pakistan. Households with lower PMT scores receive priority for Benazir Income Support Programme (BISP), Ehsaas Emergency Cash, and other welfare initiatives.
A fair PMT calculation ensures that genuinely needy families aren’t overlooked while preventing affluent households from accessing benefits they don’t require. This scoring system has become fundamental to Pakistan’s poverty alleviation strategy.
Role of NSER in PMT Calculation
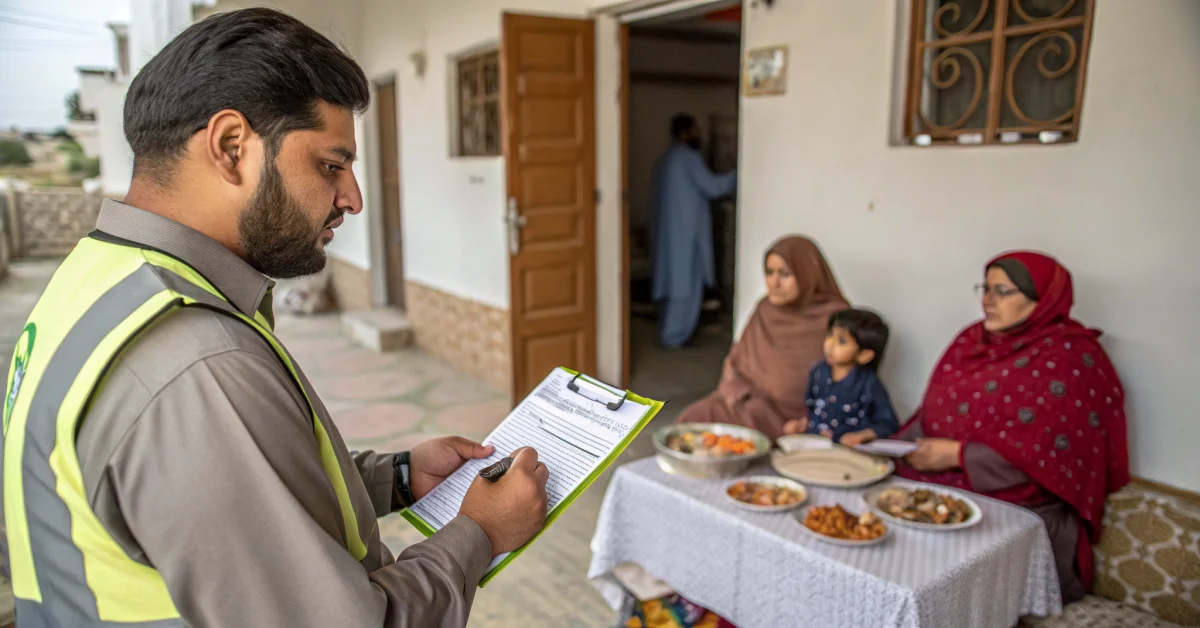
The NSER collects detailed household information through trained surveyors who conduct door-to-door assessments. This data forms the foundation of the PMT algorithm, which applies mathematical weightage to various factors to produce a final score.
The NSER database is continuously updated and cross-referenced with other government databases like NADRA to ensure accuracy and prevent fraud.
What Data Is Collected in the NSER Survey?
The NSER survey gathers multifaceted information about each household to create a comprehensive socioeconomic profile. This data collection is thorough and systematic, ensuring that the PMT scoring algorithm has sufficient information to make fair assessments.
Household Income Information
Surveyors document all sources of household income, including salaries, wages, agricultural earnings, business income, and remittances from abroad.
Self-reported income is cross-checked against employment documents, tax records, and other official sources when available.
Income stability and regularity are also assessed, as seasonal or irregular earnings affect the household’s true economic status differently from stable employment.
Family Size and Dependents
The number of household members and the ratio of dependents to earners significantly influence PMT calculations. A household with five dependents and one earner faces different economic pressures than a household with two earners and one dependent.
The survey records the age, gender, and relationship of each family member to assess dependency ratios accurately.
Assets and Living Conditions
Surveyors document owned properties, vehicles, livestock, and valuable possessions. They also assess housing quality—noting construction materials, room count, access to utilities, sanitation facilities, and basic amenities. Families living in concrete structures with multiple rooms and access to clean water score higher than those in temporary shelters without proper facilities.
These tangible indicators reveal household wealth more reliably than income alone.
Education and Employment Status
The educational qualifications of household members and their employment status are recorded. A household where the primary earner is unemployed or semi-employed requires more assistance than one with stable, skilled employment.
The survey also identifies school-aged children not enrolled in education, which can unlock education-focused welfare programs.
How PMT Score Is Calculated Step by Step in NSER System
The PMT score calculation involves a sophisticated algorithmic process that transforms raw household data into a single numerical indicator. Each step is designed to ensure consistency, accuracy, and fairness across millions of assessments.
Step 1 – Data Collection During Survey
Trained NSER surveyors conduct in-person household visits using standardized questionnaires. They gather information across income, assets, housing, education, and employment categories.
The surveyor verifies claims by observation—checking property ownership documents, observing living conditions, and asking detailed follow-up questions to detect inconsistencies. This primary data collection is the foundation upon which all subsequent calculations rest.
Step 2 – Data Entry into NSER Database
Once surveys are completed, data is entered into the centralized NSER database through a secure digital system. Quality control officers verify data entry accuracy and flag incomplete or suspicious entries for re-survey.
The database structure is designed to accommodate all variables consistently, enabling fair comparison across regions and timeframes.
Step 3 – Application of Scoring Formula
The PMT algorithm applies a regression-based scoring formula that weights different variables based on their correlation with poverty and economic vulnerability.
The formula is not arbitrary—it’s developed through statistical analysis to identify which factors best predict household poverty status. Income, asset ownership, and housing conditions typically receive significant weightage, while other factors receive proportional weights.
Step 4 – Weightage of Household Factors
Different factors contribute differently to the final PMT score. Income typically carries substantial weight, but asset ownership can override income declarations—a household reporting low income but owning extensive property receives a higher PMT score.
Household size is weighted to ensure larger families aren’t penalized unfairly. Educational attainment influences employability weighting. These proportional weightings create a nuanced score reflecting true economic status.
Step 5 – Final PMT Score Generation
The algorithm produces a numerical PMT score, typically ranging from 0 to 100 or utilizing decile rankings. Lower scores indicate greater poverty and vulnerability, making such households eligible for more intensive support programs.
The final score is generated automatically by the system, reducing human bias and ensuring consistent application of the formula across all households.
Factors That Affect PMT Score the Most
While the PMT algorithm incorporates numerous variables, certain factors disproportionately influence final scores. Understanding these key drivers helps households comprehend their assessment.
Income Level Impact
Monthly household income remains one of the strongest predictors of PMT score. However, income alone doesn’t determine the score—a household earning Rs. 30,000 monthly with substantial property assets scores differently from an equally earning household with no property. The algorithm contextualizes income within the household’s total economic picture.
Property and Asset Ownership

Real estate holdings, vehicles, and valuable possessions significantly elevate PMT scores. A household owning agricultural land or urban property cannot claim poverty status, regardless of current income levels. This prevents wealthy households from accessing welfare through temporary income fluctuations. Asset ownership serves as a reality check against income manipulation.
Household Size Effect
Larger households typically receive lower PMT scores (greater vulnerability ratings) as their per-capita resources diminish. A Rs. 50,000 monthly income supporting five people represents greater vulnerability than the same income supporting two people. The algorithm adjusts for household composition to prevent unfair comparisons.
Employment Status Influence
Stable, full-time employment improves PMT scores more favorably than self-employment or daily wages. Unemployment significantly reduces PMT scores, indicating vulnerability.
The algorithm recognizes that employment stability affects household economic resilience and future earning potential. Seasonal employment patterns are analyzed to determine true average income.
How PMT Score Is Verified After Calculation
Quality assurance mechanisms ensure PMT scores reflect accurate assessments and prevent fraud or errors from affecting welfare distribution.
Cross-Checking with NADRA Data
NSER data is cross-referenced with NADRA (National Database and Registration Authority) records to verify household member identities and detect duplications.
If a household claims a different composition or income level than NADRA records indicate, discrepancies are flagged for investigation. This integration prevents fraudulent registrations and ensures data consistency.
Field Verification Process
Random field audits involve senior surveyors revisiting selected households to verify original survey accuracy. If discrepancies are discovered, the case is flagged for immediate re-survey.
This verification process deters falsification and maintains system integrity. Households reporting suspiciously low income or undisclosed assets face additional scrutiny.
Error Correction and Updates
Households can file appeals if they believe their PMT score misrepresents their economic status. Supporting documentation—property deeds, employment contracts, bank statements—can be submitted for recalibration.
The system includes provisions for updating scores when major life changes occur, such as job loss, property acquisition, or family composition changes.
Common Misunderstandings About PMT Calculation
Several misconceptions about PMT scoring persist among Pakistani households, affecting how people approach surveys and interpret results.
Why PMT Score Is Not a Fixed Number
Many believe PMT scores remain permanent once calculated. Actually, scores can change when household circumstances change or when data updates occur. Re-surveys, appeals, and database corrections can alter PMT scores.
The system aims to reflect current socioeconomic status, not historical snapshots. Regular updates ensure that scores stay relevant to actual conditions.
Difference Between Income and PMT Score
Households often conflate reported income with PMT scores, assuming higher income automatically produces higher scores. PMT scores incorporate income alongside assets, housing, education, and employment stability.
A high-income household with low assets might score differently than expected. PMT scores measure comprehensive economic vulnerability, not income alone, making the relationship more complex than a simple correlation.
Final Thoughts – Importance of Accurate NSER Data
Why Honest Information Leads to Fair Results
The PMT scoring system works fairly only when households provide honest, accurate information during NSER surveys. Misrepresentation harms genuinely vulnerable households by inflating competition for limited resources. When accurate data is submitted, the algorithm allocates welfare support to those most needing it.
Understanding how the PMT score is calculated step by step in the NSER system encourages transparency and supports Pakistan’s poverty alleviation objectives. Citizens who participate honestly in the survey process contribute to a more equitable distribution of government resources and help ensure that social protection programs reach their intended beneficiaries.
The NSER represents a significant advancement in objective, data-driven welfare administration—a system that works best when public cooperation and honesty meet rigorous verification processes.

I am Shan ALI, a Pakistani digital content creator with a strong interest in public welfare, government programs, and making official information accessible to ordinary citizens.